 Global Plastic Raw Material Price Trends (2025–2026): A Complete Market Intelligence Guide
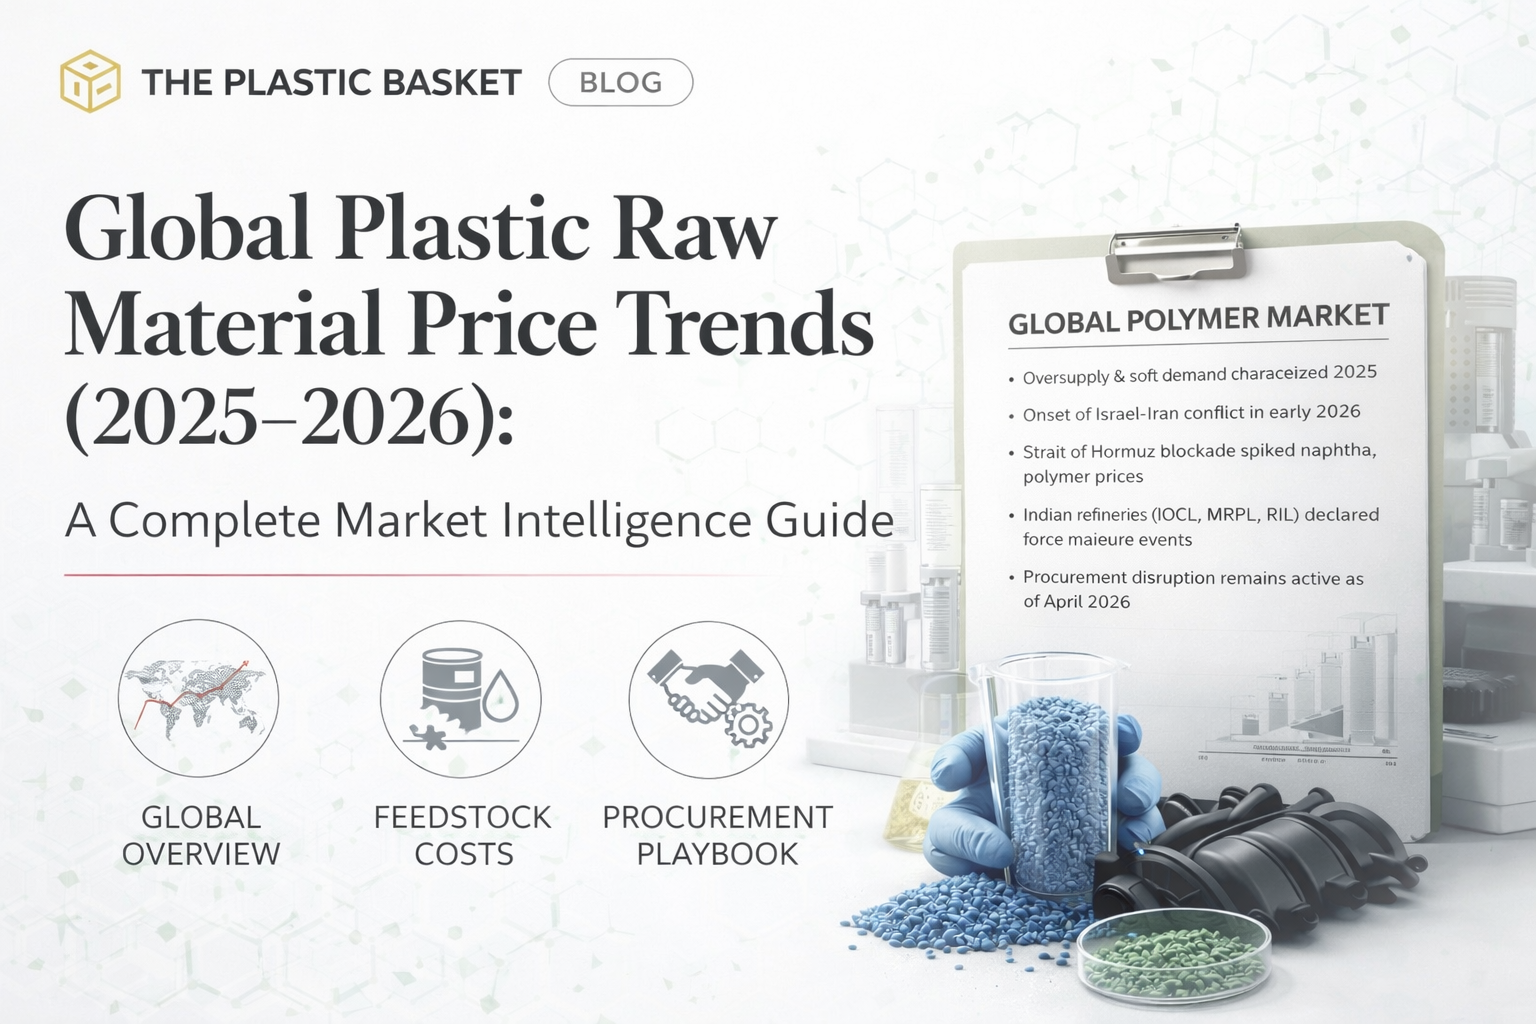
The global polymer market entered 2025 in a broadly oversupplied, bearish state — weak demand, cautious buyers, and falling feedstock costs had created what was, for much of the year, a buyer’s market across PP, PE, PVC, and PET. That calculus changed dramatically on February 28, 2026, when the outbreak of the Israel–US–Iran conflict and the effective blockade of the Strait of Hormuz triggered what the IEA has described as “the largest supply disruption in the history of the global oil market.”
This blog covers both phases — the 2025 price journey and the sharp 2026 inflection — and provides material-by-material analysis, regional snapshots, and an actionable procurement playbook for navigating what is now a highly volatile, rapidly repricing market.
Key takeaways at a glance:
Polymer prices operate as a layered system. Understanding each layer helps you interpret directional signals correctly:
Layer 1 — Upstream energy & feedstock: Crude oil and naphtha prices are the most upstream lever. For naphtha-cracker-based producers (dominant in Asia and Europe), polymer prices closely track crude via naphtha. For ethane-based crackers (dominant in North America), the linkage to crude is weaker, giving US producers a structural cost advantage during oil price spikes. The IEA, EIA, and ICIS are the primary references for monitoring feedstock trends.
Layer 2 — Regional manufacturing capacity: New cracker start-ups, planned maintenance, and unplanned shutdowns create multimonth supply shifts. China’s aggressive capacity expansion through 2023–2025 was the dominant bearish theme for PP and PE across Asia. The March 2026 crisis has reversed this, with multiple Asian crackers halting operations.
Layer 3 — Downstream demand cycles: Packaging seasonality, automotive production volumes, construction spending, and agricultural cycles govern consumption and short-term inventory drawdowns. Festive seasons (Diwali, Chinese New Year, summer packaging) typically create regional demand surges.
Layer 4 — Logistics, trade, and policy: Freight rates, tariffs, and recycling mandates can abruptly shift price parity and local availability. The Strait of Hormuz blockade is the most severe logistics disruption event this market has seen — approximately one-fifth of global oil flows, and a major share of Gulf petrochemical exports, pass through this chokepoint.
Caveat: This article focuses on directional trends, drivers, and signals. For transactional pricing, consult live price services (ICIS, Platts, Plastemart, Nexizo) or supplier quotes directly.
Before diving into material-specific trends, it is important to understand the 2025 baseline — because it makes the 2026 price shock even more significant.
Through most of 2025, the polymer market was characterised by:
Oversupply from Chinese capacity expansion: China became essentially self-sufficient in PP and accelerated exports to Asia, depressing regional prices. PP prices in China averaged around USD 1,054–1,060/MT in Q1 2025, with downward pressure persisting through Q3. Southeast Asian markets were flooded with competitively priced Chinese material.
Weak downstream demand: Automotive, packaging, and consumer goods sectors in Asia and Europe showed subdued buying. Buyers deferred procurement, built minimal inventories, and operated hand-to-mouth. This sentiment prevailed across PP, PE, and PVC through most of the year.
Falling feedstock costs: Crude oil and naphtha eased during the year, reducing cost-side support for polymer prices. This further reinforced the bearish trend, especially in the second half of 2025.
A buyer’s market in global resin negotiations: In the US, spot prices for PE, PP, and PVC were reported at 8–10 cents/lb below contract prices in December 2025, as buyers shifted toward the spot market to fulfil 2026 needs at lower cost.
India saw a mixed picture: while the global trend was soft, domestic suppliers including Reliance Industries made periodic upward price revisions (notably in January 2026 for PP), reflecting local supply-demand tightness and currency depreciation effects on import economics.
On February 28, 2026, Israel and the United States launched joint air strikes on Iran. Iran retaliated and, critically, blocked the Strait of Hormuz — the narrow waterway through which approximately 20 million barrels per day of crude oil and petroleum products normally flow.
The impact on polymer markets has been severe and fast:
Crude oil surged above USD 100/barrel — Brent crossed USD 103/barrel, with prices up 35–50% at peak levels from pre-conflict levels. This directly fed into naphtha and all downstream polymer feedstocks.
Naphtha prices surged nearly 74% in two weeks — from USD 619–621/MT to USD 1,077–1,079/MT CFR East Asia between early and mid-March. This is an extraordinary and historically unprecedented move for a feedstock that typically moves gradually.
Polymer prices surged 25–75% across grades in the first weeks of March 2026. PP in Asia rose around 9%; PVC in India crossed ₹114/kg at the bulk resin level; ethylene in Northeast Asia reportedly doubled to USD 1,351/MT.
Plant shutdowns across Asia: LG Chem halted its Yeosu naphtha cracker; Yeochun NCC stopped propylene operations; TPC Singapore declared force majeure on March 9 due to lack of olefin feedstock; Saudi Arabia’s Advanced Petrochemical Company declared force majeure on PP supplies to Asia through March 31, 2026.
India’s domestic supply tightened sharply: Indian Oil Corporation (IOCL) shut a polypropylene unit in Paradip due to propylene shortages. Mangalore Refinery (MRPL) halted a key refinery unit. Nayara Energy announced a 35-day maintenance shutdown in early April. Reliance Industries cut aromatics production, resulting in a loss of approximately 75,000 tonnes of paraxylene output. All major domestic producers raised prices proportionately.
The IEA, in its March 2026 Oil Market Report, estimated global crude supply was being curtailed by at least 8 million barrels/day, with a further 2 mb/d of condensates and NGLs shut in — and reduced its 2026 global oil demand growth forecast by 210,000 barrels/day to 640,000 barrels/day.
The outlook as of April 2026: Polymer prices are expected to remain firm with an upward bias as long as geopolitical tensions persist and the Strait of Hormuz remains effectively closed. Strategic reserve releases by IEA member countries (400 million barrels authorised) may offer temporary crude price relief, but they do not address the shortage of petrochemical feedstocks specifically. Procurement teams should treat this as a structural disruption scenario until shipping routes normalise.
Market size and context: The global PP market is estimated at USD 103 billion in 2026, projected to reach USD 160.5 billion by 2036 at a 4.5% CAGR. It is the second-most widely produced commodity plastic globally.
2025 journey: PP experienced broad-based price declines across regions through most of 2025. In Asia, prices dropped in H2 2025 as China produced at record levels and became self-sufficient, redirecting exports to regional markets. Japan also suffered oversupply as US-tariff-diverted shipments returned to local markets. In Q3 2025, PP prices in India (Ahmedabad) fell 4.1% in September alone, driven by weak automotive and consumer goods demand and competitive US-origin imports.
By December 2025, PP prices in Northeast Asia had declined to around USD 0.99/kg, while India sat at approximately USD 1.08/kg — down from USD 1.08–1.10/kg ranges seen earlier in 2025. Europe was broadly flat but declining in late H2.
India was heading into 2026 under “pronounced supply pressure,” with oversupply embedded after a turbulent 2025, weak downstream demand, and a steadily depreciating rupee creating a structurally challenging local market.
March 2026 shock: PP prices in Asia surged approximately 9% in early March 2026 amid the Middle East crisis. In India, PP rose sharply by around 7% within weeks. Reliance Industries announced PP price increases effective April 1, 2026: Homo-PP up ₹3/kg, BOPP and RAF grades up ₹4/kg, PP ICP and RCP up ₹5/kg, Deemed Export grades up ₹7/kg. As of late March, PP Futures on Chinese exchanges were trading at approximately 9,269 RMB/MT.
Key drivers to monitor:
Reference: ICIS PP Hub, Plastemart India daily PP price updates, ChemOrbis Southeast Asia PP analysis
Market size and context: The global polyethylene market was valued at USD 171.25 billion in 2025, projected to reach USD 278.96 billion by 2035 at a 5% CAGR. Asia Pacific accounts for 51% of global consumption. HDPE is the dominant sub-segment; LLDPE is the fastest-growing.
2025 journey: PE tracked the broader petrochemical weakness through 2025. On Chinese exchanges, PE fell from around 6,750 CNY/T to year-lows, finishing approximately 15% below year-ago levels by February 2026. HDPE in the US reached USD 1,200/MT in September 2025 before declining to USD 1,170/MT by December. In China, HDPE dropped to USD 1,074/MT by December. Germany’s HDPE fell to USD 1,005/MT.
India was a notable exception in Q3 2025: HDPE prices in Ahmedabad rose 2.9% in Q3, driven by strong packaging demand ahead of the festive season. However, the broader trend by December 2025 showed softness across PE grades as festive restocking faded, imports increased, and buyers restricted purchases.
LLDPE prices in March 2026 (pre-crisis snapshot): Northeast Asia USD 1.04/kg; India USD 1.10/kg; Europe USD 1.32/kg; North America USD 0.86/kg — the last figure reflecting North America’s ethane-based feedstock advantage, which has only grown more significant post-crisis.
March 2026 shock: PE prices surged alongside all other polymers driven by the ethylene feedstock spike. Ethylene in Northeast Asia reportedly doubled during the crisis period. North American producers (using ethane rather than naphtha) are relatively insulated — companies like Dow have emerged as relative winners in this environment, while Asian naphtha-cracker-based PE producers face severe margin compression.
2026 outlook: A gradual upward trend had already been forecast for 2026 based on packaging and infrastructure demand recovery. The geopolitical disruption has accelerated the upward price trajectory significantly beyond earlier forecasts.
Key drivers to monitor:
Reference: ICIS PE Hub, Nexizo India HDPE price tracker, IMARC LLDPE pricing report
Market size and context: The global PVC market was valued at USD 47 billion in 2024, projected to grow at 3.6% CAGR to USD 65.7 billion by 2033. In India, strong government infrastructure spending (Jal Jeevan Mission, PMAY) supports 10–12% volume growth in PVC pipe manufacturing.
2025 journey: PVC showed weaker correlation to crude oil than polyolefins, given that its feedstock chain runs through chlor-alkali chemistry (ethylene → EDC → VCM → PVC). This partially insulated it from upstream oil moves but made it sensitive to energy costs (electricity and coal for chlor-alkali plants) and construction demand cycles.
Through late 2025, PVC prices softened globally: plant operating rates in the US dropped to the low 80s percentage-wise; the traditional pipe market saw a demand drop; India chose not to impose anti-dumping duties (ADD) on PVC imports, keeping Chinese commodity-grade material flowing in at competitive rates. PVC Futures on Chinese exchanges were trading around 5,540–5,551 RMB/MT as of end-March 2026.
March 2026 shock: PVC has been hit by what analysts describe as a “bifurcated market.” On one hand, geopolitical disruption caused East Asian producers (Hanwha, SCGC) to declare force majeure due to Middle East logistics disruptions, tightening global PVC supply. Crude crossing USD 103/barrel pushed naphtha up USD 60/MT, forcing structural repricing across all polymers. Indian refineries are now prioritising LPG over petrochemical feedstocks, threatening a 30–40% capacity cut in domestic polymer production. Bulk PVC resin in India has reached ₹114/kg, with retail PVC pipe prices reaching ₹140–₹170 per foot for 4-inch variants.
On the other hand, Chinese commodity-grade PVC continues to flow into India at discounted rates (approximately ₹1,02,000/MT) due to weak domestic Chinese demand, creating a market split between premium grades tightening in supply and commodity Chinese imports remaining available at lower prices. Reliance announced a PVC price increase of ₹2/kg effective April 1, 2026.
Key drivers to monitor:
Reference: Nexizo India PVC daily report, Plastemart polymer news, ICIS PVC pricing
Market size and context: The global PET market reached USD 35.68 billion in 2025, projected to grow at a 4.96% CAGR to USD 56.40 billion by 2034. The rPET market was valued at USD 19.38 billion in 2025, expected to reach USD 21.78 billion in 2026. Asia Pacific holds approximately 48% of global PET production.
2025 journey: PET dynamics in 2025 were shaped by two distinct forces. For virgin PET, the relationship to crude oil ran through feedstocks PTA (purified terephthalic acid) and MEG (monoethylene glycol) — both petrochemical derivatives. In October 2025, PTA was priced at approximately USD 905/MT and MEG at USD 630/MT, rising to USD 920/MT and USD 655/MT respectively by April 2026.
The most significant disruption in 2025 was the US government’s September 2025 inclusion of PET in its reciprocal tariff list. Virgin PET spot prices jumped 6–9 cents/lb within a month of the announcement. Critically, rPET was included in the same tariff classification — a move that caught sustainability-focused brands off guard, as it narrowed or eliminated the cost advantage recycled material had previously held over virgin resin. Imported rPET flake and pellets faced potential price increases of 8–14 cents/lb as a result.
Despite this disruption, the longer-term rPET story remains structurally positive. In 2025, rPET commanded a 15–25% premium over virgin PET in many markets due to strong demand from sustainable packaging programmes, particularly from beverage and FMCG companies. This premium reflects not just policy tailwinds but genuine brand-owner demand, especially in Europe where the EU Green Deal and Plastic Tax are accelerating rPET adoption. Asia Pacific accounts for 45% of the global rPET market.
March 2026 snapshot: PET prices in March 2026 varied significantly by region — Northeast Asia at USD 0.97/kg (up 4.3% month-on-month), Africa at USD 1.05/kg (down 1.9%), and Europe at USD 1.38/kg (up 0.7%). The geopolitical disruption is pushing PTA and MEG prices higher alongside crude, which will feed through to PET in the coming weeks.
Key drivers to monitor:
Reference: ICIS PET Hub, IMARC PET pricing report, Grand View Research rPET market data
India is at the sharpest end of the current disruption. As a major crude oil importer, it is exposed to both higher feedstock costs and currency depreciation effects on import economics. Domestic producers — Reliance Industries, IOCL, HPCL — have all raised prices across polymer grades effective April 1, 2026. Key refineries including IOCL Paradip, MRPL Mangalore, and Nayara Energy have reduced or halted polymer production. India’s annualised inflation rate was already rising (3.21% in February 2026), and further polymer price increases will filter through to packaging, automotive, and construction sectors. The rupee, at approximately ₹93–94 per USD as of late March, amplifies the cost of any polymer imports denominated in dollars.
India’s medium-term demand outlook remains structurally positive: the automotive sector’s shift toward engineering-grade PP and speciality polymers for lightweighting, continued infrastructure investment in PVC pipes and fittings, and strong HDPE demand from agriculture and e-commerce packaging all support growth. However, the near-term (Q2 2026) picture is one of sharply higher costs and supply tightness.
China’s dominant capacity additions in PP and PE throughout 2023–2025 created the oversupply backdrop that kept Asian polymer prices depressed for much of last year. Going into 2026, China was already exporting aggressively to maintain utilisation rates. The Middle East conflict has tightened Chinese feedstock availability (several steam crackers have cut rates), but China’s domestic demand weakness means it continues to export commodity-grade PVC and some PE to markets like India at discounted prices, creating a complex dual dynamic for Indian buyers.
The region was already under pressure from Chinese export competition and weak domestic demand in 2025. The March 2026 supply shock has hit naphtha-dependent producers particularly hard. Singapore’s Jurong Island petrochemical complex saw multiple plant shutdowns (TPC, PCS and related downstream facilities). Supply tightness is likely to push Southeast Asian buyers toward Indian or Middle Eastern alternatives if those routes normalise.
Historically the region’s feedstock advantage (cheap associated gas, ethane access) made Gulf petrochemical producers among the world’s most competitive exporters to Asia. That advantage is now being directly disrupted by the conflict. Saudi Arabia’s Advanced Petrochemical Company declared force majeure on PP supplies through at least March 31, 2026. The extent to which Gulf production and export capacity recovers will be the single biggest variable determining H2 2026 polymer price direction globally.
European polymer producers face the dual burden of high energy costs (pre-existing) and now severely constrained feedstock availability from the Middle East. LyondellBasell declared force majeure on several polymer lines, citing economically unsustainable feedstock costs. European PP was priced at USD 1.57/kg in March 2026, the highest globally. The Carbon Border Adjustment Mechanism (CBAM), in effect since early 2025, has added approximately €0.05–0.08/kg to imported polymer costs, providing some protection for domestic producers even in this environment.
The ethane-based cracker advantage that US producers hold has become dramatically more valuable in the current environment. Companies like Dow, which produce PE from ethane rather than naphtha, are structurally insulated from the oil-linked feedstock spike affecting Asian and European rivals. US PE producers are also benefiting from elevated global polymer prices while maintaining lower input costs. North America PP homopolymer was priced at USD 1.24/kg in March 2026; LLDPE in North America sat at USD 0.86/kg — the most competitive in the world.
Recycled polymers are no longer a niche consideration — they materially affect supply, demand, and price parity across several resin chains. The current crisis has introduced new complexities for recycled material procurement.
rPET: The US tariff inclusion of rPET in September 2025 narrowed its cost advantage over virgin material significantly. In 2025, rPET commanded a 15–25% premium in many markets due to sustainability demand — not a discount. In Europe, EU Green Deal mandates and plastic taxes continue to drive adoption regardless of cost parity. India’s rPET market remains constrained by limited collection infrastructure and processing capacity, keeping local recycled PET pricing volatile.
rPP and rPE: Mechanical recycling availability and quality continue to influence substitution economics. Chemical recycling investments (glycolysis, depolymerisation, enzymatic processes) will gradually change supply dynamics over the next 3–7 years, but remain limited in commercial scale today. OECD and UNEP analyses increasingly show circularity policy has a rising influence on polymer markets, particularly in Europe.
Procurement recommendation: Model scenarios using both virgin and recycled price parity. Include quality acceptance criteria in supplier agreements for r-grades, and monitor local collection and processing capacity closely, as this is the binding constraint on rPET and rPP availability in India specifically.
Monitor these weekly or monthly to anticipate price direction:
| Indicator | Frequency | Source | Why It Matters |
|---|---|---|---|
| Brent / WTI crude price | Daily | EIA, Trading Economics | Upstream signal for all naphtha-linked polymers |
| Strait of Hormuz shipping status | Daily (current crisis) | IEA, Reuters, ICIS | Direct feedstock supply impact |
| Naphtha CFR East Asia price | Weekly | ICIS, Platts | Most direct feedstock input for Asian crackers |
| Ethylene / propylene spot spreads | Weekly | ICIS | Cracker economics and PP/PE cost floors |
| Cracker / PDH maintenance schedules | Monthly | ICIS capacity notes | Regional supply shocks |
| India domestic PP/PE price revisions (RIL, IOCL) | As announced | Plastemart, Plastic4trade | Immediate procurement cost impact |
| China PP/PE export volumes | Monthly | Customs data, ChemOrbis | Asian supply oversupply/undersupply signal |
| INR/USD exchange rate | Daily | RBI, Trading Economics | Import parity for Indian buyers |
| EIA Short-Term Energy Outlook | Monthly | EIA | Crude oil demand/supply forecast |
| rPET policy updates (India, EU) | As announced | OECD, MoEFCC | Recycled material cost and availability |
For procurement and commercial teams navigating the current environment:
1. Secure near-term supply now, don’t wait for prices to normalise. The Strait of Hormuz disruption is not a 2–3 week event. With major plants under force majeure and Indian domestic production curtailed, waiting for normalisation before covering requirements risks production stoppages. Securing supply at current elevated prices may be preferable to unavailability.
2. Differentiate between commodity grades and speciality grades. The current disruption is hitting all grades, but speciality and engineering-grade polymers (glass-filled PP, ABS, PPO, impact copolymers) face tighter supply since fewer producers make them. Prioritise securing these first.
3. Evaluate North American origin material. US-origin PP and PE — which benefits from ethane-based cracker economics — may offer better price stability and availability than Asian or Middle Eastern material right now. Factor in freight costs and lead times.
4. Revisit your import parity calculations weekly. With the rupee at ₹93–94/USD and polymer prices moving daily, landed cost calculations are changing rapidly. Static import parity models from early 2026 are already outdated.
5. For rPET buyers: reassess cost parity immediately. The US tariff regime, geopolitical disruption, and feedstock cost increases have all shifted the virgin vs. recycled cost equation. Run a fresh analysis before assuming recycled material still offers a price advantage.
6. Diversify suppliers and origins. Single-source dependencies — whether on Gulf producers, specific Indian manufacturers, or Southeast Asian traders — are being exposed. Build supplier redundancy now.
7. Embed leading indicators into your weekly dashboard. Track the Brent price, naphtha CFR East Asia, and India domestic PP/PE revision announcements as a minimum. The Plastic4trade daily polymer news feed and Plastemart updates are useful free reference points for Indian buyers.
Recommended update schedule:
Suggested data subscriptions:
Q: Do polymer prices track crude oil? A: Yes — for most commodity polymers produced in Asia and Europe, the correlation runs through naphtha. For North American polymers produced from ethane, the correlation to crude oil is weaker. The strength of the correlation also varies by resin: PP and PE track it closely; PVC has a weaker link because chlor-alkali chemistry introduces separate cost variables. In the current crisis, the crude correlation is extremely strong and direct for all naphtha-linked polymers.
Q: Is recycled plastic always cheaper than virgin? A: No — and in 2025–2026, this assumption is particularly unreliable. rPET commanded a 15–25% premium over virgin PET in many markets due to sustainability demand. rPP and rPE economics depend heavily on collection infrastructure, quality, and regional policy. The US September 2025 tariff on rPET further compressed its cost advantage. Always model virgin vs. recycled parity fresh for your specific grade, region, and use case.
Q: How often should procurement check prices? A: In the current crisis environment — daily for Brent crude and domestic revision announcements; weekly for feedstock spread analysis; monthly for strategic inventory and contract positioning. Under normalised market conditions, weekly feedstock and monthly resin benchmark reviews are sufficient.
Q: What’s the single biggest risk for Indian polymer buyers in 2026? A: Supply unavailability. The combination of domestic production curtailments (IOCL, MRPL, Nayara) and disrupted Gulf supply chains creates a scenario where even buyers willing to pay elevated prices may struggle to secure material in the near term, particularly for engineering and speciality grades.
This article is intended for informational and market intelligence purposes. For transactional pricing, consult live price services or supplier quotes. The polymer market situation as of April 2026 is fast-moving; figures cited reflect conditions at the time of writing and should be verified against current data before making procurement decisions.
© 2025 -The Plastic Basket